Manual territory design with full visual control
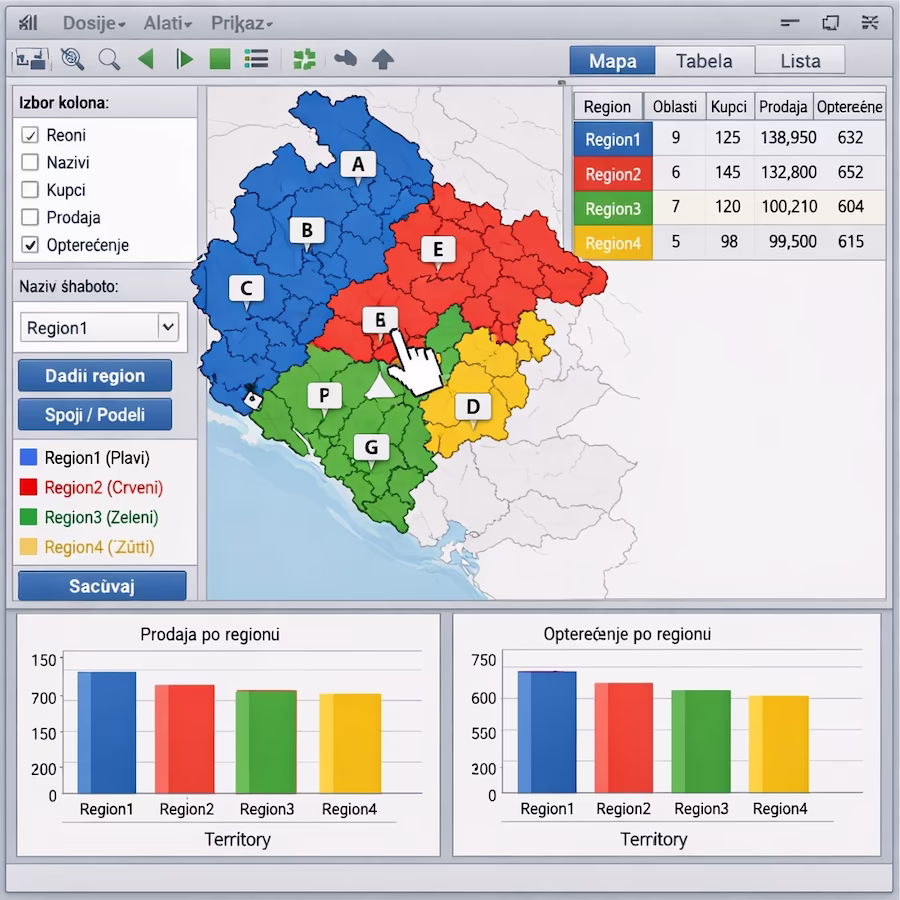
MobTrack24 Territory Design allows users to manually design territories directly on the map, using a territory drawing tool that makes the process transparent, intuitive and flexible. As the user marks territories on the map, the system automatically synchronizes data between the map, table and graph, providing instant insight into key statistics for each territory. Tabular overviews, visualization through bar graphs, as well as the possibility of automatically updating the display during operation are available. Thanks to editing and undoing functions, the user can easily experiment with different variants of territorial division and find the solution that best suits the business goals.
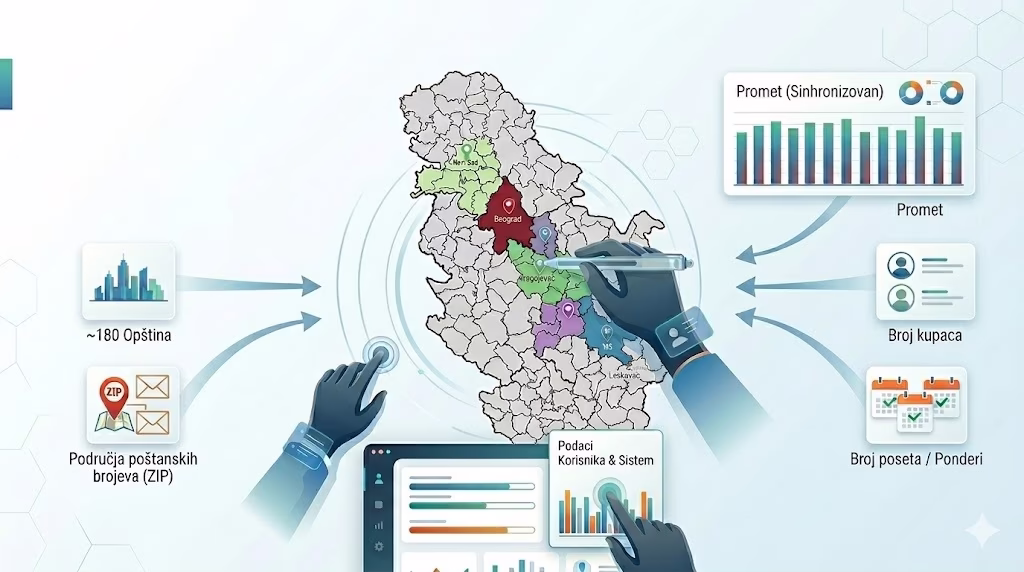
MobTrack24 Territory Design enables manual territory design directly on the map, with automatic synchronization of data in tables and graphs.
Visual display of territories and immediate insight into key statistics allow the user to more easily test different variants and shape the territorial division more precisely.
Manual drawing of territories directly on the map
MobTrack24 Territory design allows the user to manually form territories by simply marking areas on the map. This approach gives a high degree of control over the planning process and is especially useful when it is necessary to take into account local specificities, experience from the field or business rules that cannot be fully captured by automatic models.
Synchronized view of map, tables and graphs
During the design of the territory, the system automatically connects the map display with tabular controls and bar graphs. In this way, the user sees at all times how changes on the map affect the key indicators of the territory, which facilitates the assessment of balance, load and distribution of resources.
Easy editing and trying out different variants
MobTrack24 Territory design allows easy cancellation, correction and refinement of already drawn territories. The user can experiment with different distribution models, compare the results and gradually adjust the territories until he gets the optimal relationship between geographic coverage and business indicators.
Result
Faster and clearer manual design of territories with constant insight into data, simple corrections and greater certainty when making decisions.
Key Benefits
Direct drawing of territories on the map
The user can manually shape territories in an intuitive way, with full control over borders and distribution.
Instant insight into key statistics
Data for each territory is displayed through tabular controls and bar graphs during the work process itself.
Automatic synchronization of all displays
Changes made to the map are immediately reflected in both tables and graphs, without additional steps.
Freedom to experiment and refine
The editing and undo functions allow to easily try out multiple variations of the territorial division.