Interactive graphs of all parameters — telemetry turned into decisions
MobTrack24 converts all collected data into clear, interactive graphics — from contact, position and speed, to CAN telemetry (fuel level/consumption, RPM, temperatures, voltages, DTC errors, etc.). The graphics are synchronized with the map and pop-up details, so you always have the full context: time + location + parameters.
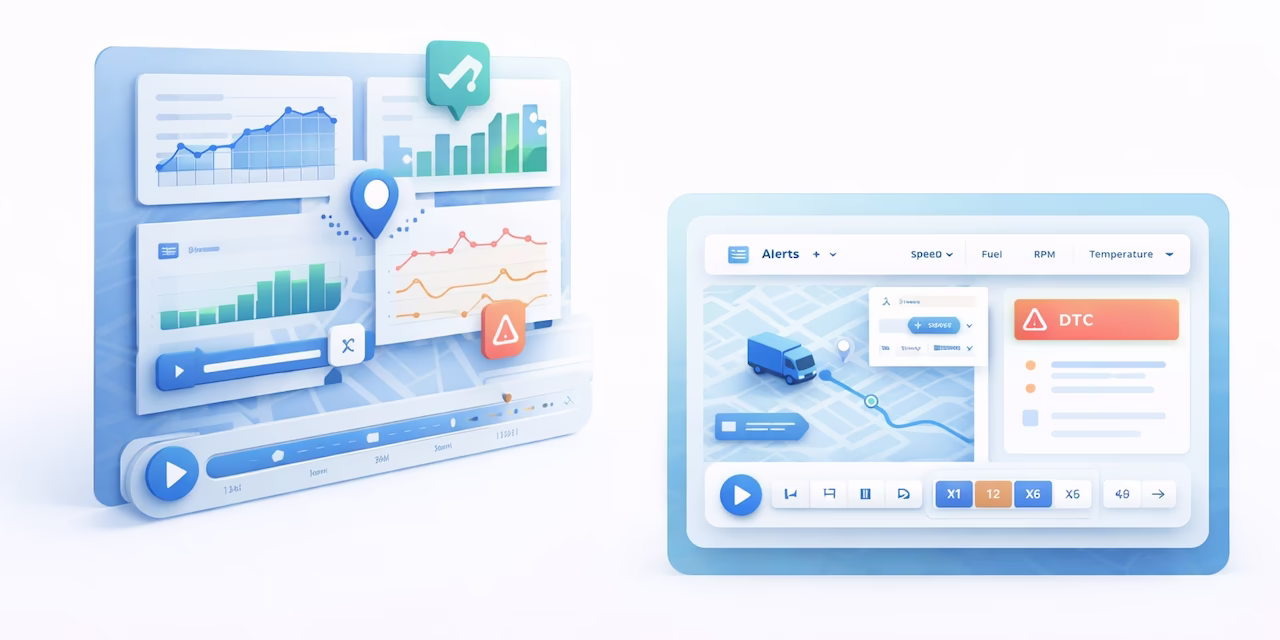
Interactive graphics of all parameters are synchronized with the map, location and time.
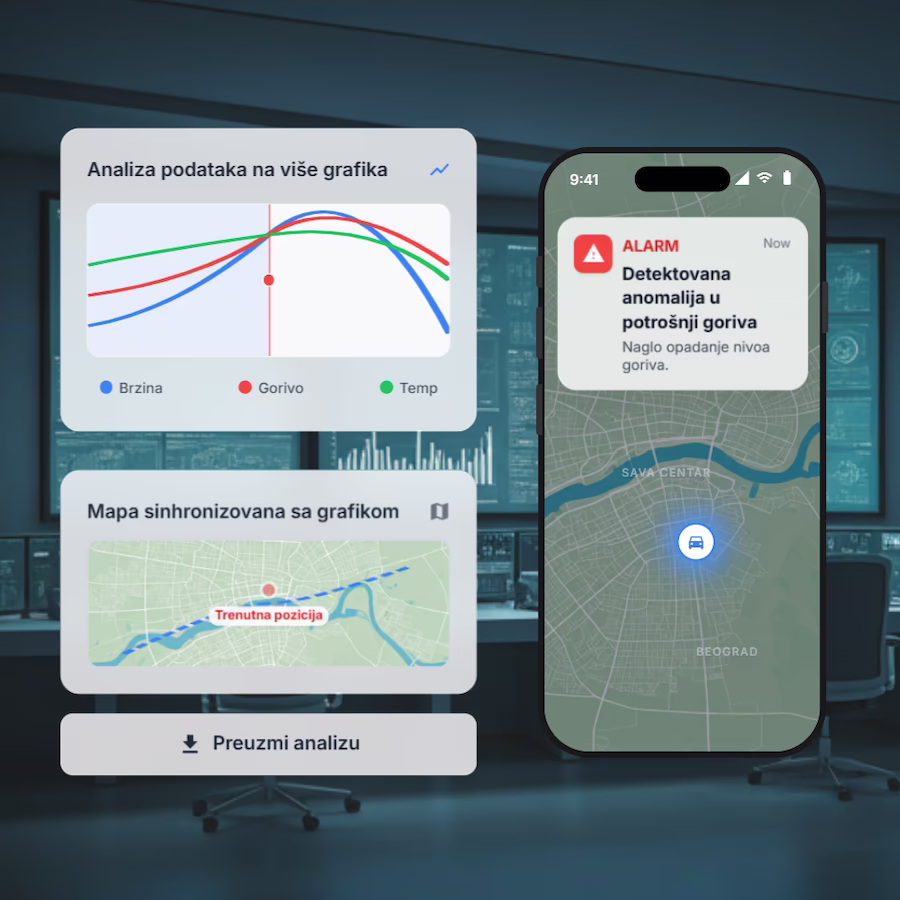
Trends and anomalies become immediately visible for faster diagnostics.
A single view of all data sources
Analyze GPS, statuses, sensors and CAN data in the same interface — without switching between screens, files and sources.
Synchronization with map and events
Each point on the graphic corresponds to a specific moment and location on the map. The pop-up displays details, and the system maintains a "single source of truth" through coordinated displays.
Quick analysis of trends and anomalies
Trends, deviations and critical moments become visible immediately — ideal for spending control, technical analysis and operational management.
Result
Faster decisions, fewer disputes and reliable visual evidence for operations and service teams.
Key Benefits
Complete 24/7 insight
Real-time and history for all parameters.
Faster diagnostics
Correlation of multiple parameters on one time axis.
Transparency
Graphics as evidence in internal controls and complaints.
Cost optimization
Easier consumption and performance management.